The Dow Held Up Friday as the S&P 500 Edged Toward a Seventh Straight Down Day and Its Longest Losing Streak in More Than Two Years
Key takeaways
- As of late Friday morning, about 11 a.m. ET, the Dow was down only about 0.24 percent while the S&P 500 fell about 1.48 percent and the Nasdaq 100 dropped about 2.98 percent, a split driven by heavy selling in chip and technology stocks.
- A lower Friday close would give the S&P 500 seven straight down days, extending a streak that is already its longest since the six sessions that ended April 19, 2024.
- Thursday stood out because the index rose as much as 1.26 percent early and still closed down 2.02 percent; by 24/7 Wall St.'s count no session since March 20, 2020 fit that specific up then down pattern, though other days since had wider overall swings.
- Nvidia fell about 7 percent to around $136.20, chipmakers dropped broadly, and the newly public Anthropic slid about 11 percent on its second day while staying just above its $83 IPO price.
- The 10 year Treasury yield eased to about 4.99 percent, but stocks and yields falling together points to a flight to safety rather than relief.
- At Thursday's close the S&P 500 sat about 8.2 percent below its October 6 record of 7,818.93, a decline on the scale of a normal pullback rather than a crash.
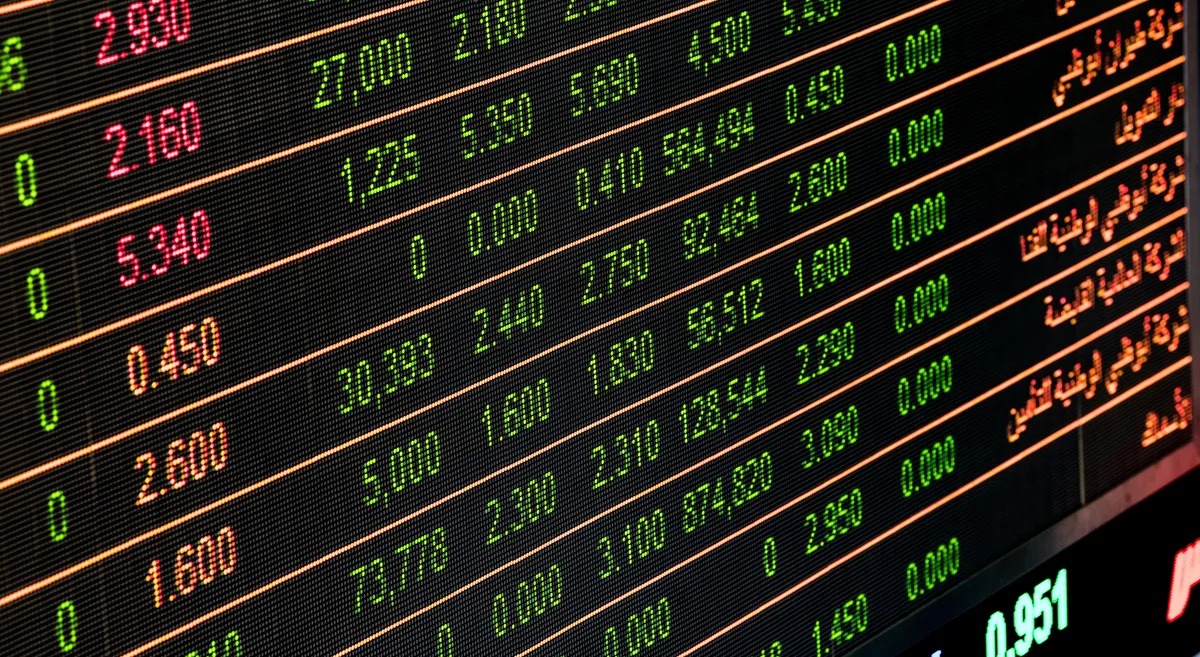
The week that pushed gold down to a 14 month low even as stocks fell rolled into its final session with a widening gap between old economy stocks and the technology names that have led for two years. As of late Friday morning, roughly 11 a.m. ET, the Dow Jones Industrial Average was holding close to flat while the S&P 500 and the Nasdaq fell harder. The funds that track the three indexes showed it plainly: around 11 a.m. ET the Dow tracking fund was down about 0.24 percent, the S&P 500 fund was off about 1.48 percent, and the Nasdaq 100 fund was down about 2.98 percent, according to live coverage from StockTitan.
That gap matters. The Dow holds thirty large companies and leans toward banks, industrials, and health care. The S&P 500 and the Nasdaq carry far more of the giant technology and chip names that have driven the market for two years. So on a morning when money rotated out of chips, the Dow held up far better while the two broader gauges sagged. One index does not tell the whole story, and Friday was a clear example of that.
The S&P 500 is one close from rare territory
The number everyone on the floor was watching is not a price. It is a streak. The S&P 500 fell for a sixth straight session Thursday, closing down 2.02 percent at 7,175.83, its longest losing run since the six sessions that ended April 19, 2024, as reported by 24/7 Wall St. If the index finishes Friday lower, that would be seven down days in a row, extending a streak that is already the longest in more than two years.
What made Thursday unsettling was not just the drop but the shape of it. The index traded up as much as 1.26 percent in the morning, reaching 7,415.64, and still closed down more than 2 percent, a swing of about three percentage points. By the count in the 24/7 Wall St. report, no session since March 20, 2020 had seen the S&P climb at least 1.26 percent and then close down 2 percent or worse. On that March 2020 day the index rose 1.81 percent and finished down 4.34 percent. Other sessions since 2020 have had wider overall point swings, including days in April 2025 and October 2022, but none fit that specific up then down pattern.
Thursday was the clearest case of a bounce that did not hold, with buyers showing up early and sellers taking over by the close. A market this oversold can snap back hard, especially on a Friday when monthly options expire and trading gets choppy, but a rebound only counts for something if it holds into the closing bell.
Chips led the way down again
The weight on the Nasdaq came from the same place it has all week. Nvidia fell about 7 percent and traded near $136.20, a level the stock had not closed below since May 30, 2025, per the morning tally from StockTitan. AMD and other chipmakers fell as well. The selling started overseas, with semiconductor shares sliding across Asia and Europe before the U.S. open, and carried straight into the morning here.
Anthropic, the maker of the Claude assistant that went public Thursday in a record debut, slid again on its second day. The stock, trading under the ticker ANT, fell about 11 percent to around $86, though it remained just above the $83 price set in its offering, according to Fortune. Anthropic opened Thursday at $111.50, well above that IPO price, and closed its first day up about 17 percent at $97.17 before Friday's slide gave back most of the pop. For a debut that was supposed to reignite enthusiasm for artificial intelligence, the first two days instead became a live test of how much the market is willing to pay for the theme right now.
There was a quieter, more hopeful signal underneath the red. The yield on the 10 year Treasury eased to about 4.99 percent, down roughly six basis points on the day. Lower yields can take some pressure off stock valuations. The trouble this week is that yields and stocks have mostly fallen together, which suggests investors are reaching for safety rather than cheering a friendlier rate backdrop.
What is actually driving the mood
Two threads run through the selling. The first is the Federal Reserve. Futures markets have been pricing a meaningful chance of a December rate move, and that expectation has firmed as recent inflation readings came in warm. Higher rates raise the bar for every risky asset, from megacap tech to crypto. The second thread is valuation anxiety around artificial intelligence. After a two year run, investors are asking harder questions about how quickly all the spending on AI infrastructure turns into profit. When a record IPO fades and the biggest chip names keep falling, it signals that the crowd is trimming exposure rather than adding to it. Some market strategists have cautioned this week that investors may be too relaxed about a pile of risks stacking up at once, from firming inflation to stretched valuations to unresolved geopolitics.
Friday's economic calendar centered on the University of Michigan's consumer survey, and the final November reading landed Friday morning. Sentiment came in at 51.5, revised up from the preliminary 51.0 and well above October's 48, its highest in three months, according to the Surveys of Consumers. Year ahead inflation expectations fell to 3.7 percent from 4.7 percent in October, and the long run outlook eased to 3.3 percent. Softer inflation expectations can be a small comfort, since they hint that households are not bracing for prices to spiral, but a single survey does not change the Fed's near term path.
What a six or seven day losing streak means for you
If you own index funds in a 401(k) or an IRA, the honest answer is that a streak like this is uncomfortable to watch and usually not a reason to act. The S&P 500 closed Thursday about 8.2 percent below its October 6 record of 7,818.93. A decline of that size is on the scale of a normal pullback, not a crash, and drops like it happen in most years. Here is one example from recent history, offered as an illustration rather than a forecast: the comparable six session streak in April 2024 ended on April 19, and the index went on to a new closing record about a month later, in mid May, according to S&P Dow Jones Indices. One episode does not establish a pattern, and nothing guarantees a repeat. The broader point is simply that losing streaks do end at some point, and that selling during one carries its own risk.
Recovery math is not symmetrical. A portfolio that falls 8 percent needs a gain of roughly 8.7 percent to get back to even, and that is true whether you hold the position or sell it. The deeper the drop, the steeper that climb. What selling actually changes is a separate risk: it turns a paper loss into a real one and can leave you on the sidelines if a rebound comes while you are out. For that reason, many long term plans lean on the plain discipline of adding steadily through rough patches rather than trying to time the exact bottom, which is hard to do consistently. The slider below lets you see how regular contributions can compound over time, using assumptions you choose rather than any forecast.
A few practical notes for the day. Monthly options expired Friday, which tends to add noise and heavier volume, and trading thins out heading into Thanksgiving week. None of that changes the long term value of the companies you own. It just makes the tape jumpier. If your plan was built for a timeline measured in years, a single volatile Friday, even one that may cap a historic losing streak, is information, not an instruction. Watch whether a rebound can hold into the close before you read too much into any one bounce.
Figures in this report are intraday as of late Friday morning, about 11 a.m. ET, and will change before the closing bell. Nothing here is a recommendation to buy or sell any security.
Most investors cannot pass a basic money test. Can you?
The market charges tuition for every gap in your knowledge. The Financial IQ Test measures what you actually know across investing, banking, credit, and retirement, then shows you exactly which gaps to close before they get expensive.
Test your Financial IQQuestions people ask
Why did the Dow hold up while the S&P 500 and Nasdaq fell?
The Dow holds thirty companies and leans toward banks, industrials, and health care, while the S&P 500 and Nasdaq carry much heavier weightings in large technology and chip stocks. On Friday morning money rotated out of chips, so the tech heavy indexes fell sharply while the Dow's steadier members kept it close to flat.
What is the big deal about a seventh straight down day?
The S&P 500 had already fallen six days in a row through Thursday, its longest streak since the six sessions that ended April 19, 2024. If Friday closes lower, that makes seven, which would extend an already notable run. It is a sentiment marker more than a fundamental one, but it signals how persistent the selling has been.
How far has the market actually fallen?
At Thursday's close the S&P 500 was about 8.2 percent below its October 6 record of 7,818.93. That is on the scale of a normal pullback rather than a crash, and declines of this size happen in most years.
Did the Anthropic IPO flop?
Not exactly. Anthropic priced its offering at 83 dollars a share. It opened Thursday at $111.50 and closed its first day up about 17 percent at $97.17, then fell about 11 percent on its second day to around $86. It stayed above its IPO price but gave back most of its first day pop, which is why people are reading it as a test of appetite for the AI theme right now.
Should I sell my index funds during a losing streak like this?
For most long term investors, selling into a decline turns a paper loss into a real one and can leave you out when a rebound comes. Getting back to even after an 8 percent drop takes about an 8.7 percent gain, and that is true whether or not you sell. The usual guidance is to keep contributing on schedule rather than trying to time the bottom, which is hard to do consistently. Your own situation and risk tolerance matter, and this is general information, not personal advice.
What was the University of Michigan reading, and what should I watch next?
The final November sentiment reading came in Friday morning at 51.5, revised up from the preliminary 51.0 and well above October's 48, with year ahead inflation expectations easing to 3.7 percent and the long run figure to 3.3 percent. From here, watch whether any morning bounce can hold into the close, since Thursday's early gain did not. Monthly options expired Friday, which adds volume and choppiness.
Keep reading

How to Choose a Brokerage Account in 2026: A Practical Guide
Dividend Investing for Beginners: Income You Can Actually See
Dollar-Cost Averaging: The Math, the Myths, and When It Wins
The Flourish Letter
One smart money idea each week, charts included. Join free and get the printable 2026 Money Calendar in your welcome email.